In this section there are the following resources:
- Ishikawa Diagram Overview
- Ishikawa Diagram Job Aid
Ishikawa Diagram oVERVIEW
WHAT
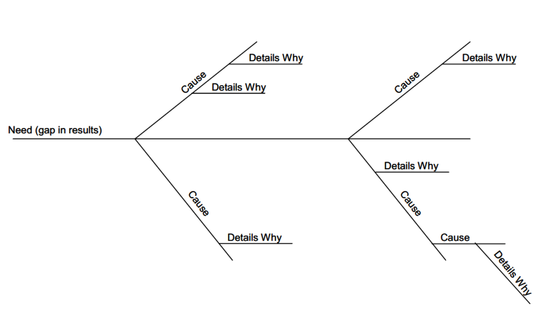
The Ishikawa diagram is often referred to as a "fishbone" diagram or a cause and effect diagram. Although the concept was first used in the 1920s, these diagrams are named for Kaoru Ishikawa who popularized them in the 1960s by using them for quality management purposes in the Kawasaki shipyards. Ishikawa diagrams are often referred to as fishbone diagrams because their shape is similar to a fish skeleton. See example below:
The Ishikawa diagram is often referred to as a "fishbone" diagram or a cause and effect diagram. Although the concept was first used in the 1920s, these diagrams are named for Kaoru Ishikawa who popularized them in the 1960s by using them for quality management purposes in the Kawasaki shipyards. Ishikawa diagrams are often referred to as fishbone diagrams because their shape is similar to a fish skeleton. See example below:
WHY
Ishikawa diagrams are used to identify the possible causes of a problem and can be helpful in categorizing and organizing the root causes of the problem.
HOW
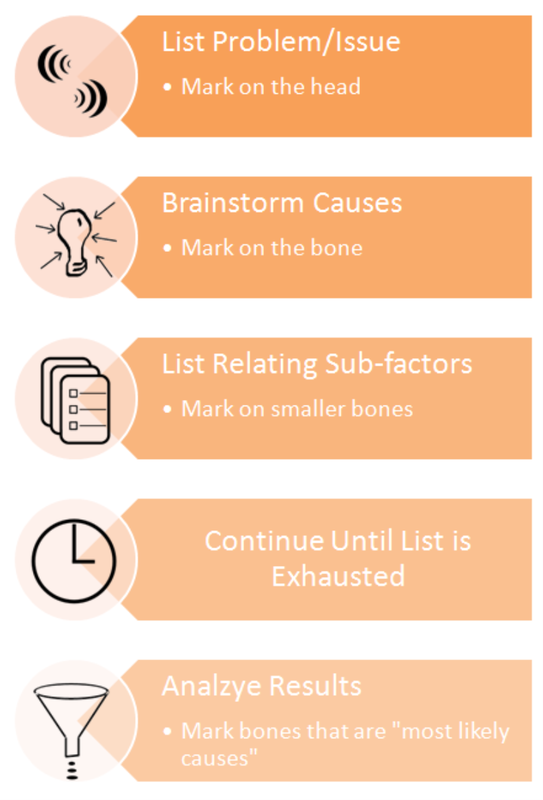
When constructing an Ishikawa diagram, you begin by stating the problem in question form, such as by asking why. This helps during the brainstorming phase by allowing team members to ask themselves this question. The problem is placed at the “head” of the fish bone diagram as seen in the picture above. Once the question has been determined, a horizontal line is drawn attached to the problem, and several vertical lines (bones) are drawn coming out of the horizontal line. These are labeled with different categories depending on the purpose of the diagram. Once this has been done, possible causes are brainstormed and put in the appropriate categories. When the Ishikawa diagram is done, it shows potential root causes of a problem. Some potential categories are listed below:
The 4 M’s (Manufacturing)
Methods
Machines
Materials
Manpower
The 4 P's (Marketing)
Place
Procedure
People
Policies
The 4 S's (Service)
Surroundings
Suppliers
Systems
Skills
ADVANTAGES
DISADVANTAGES
USE IN THE REAL WORLD
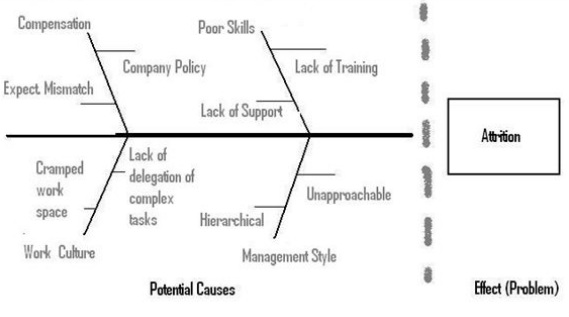
Employers can use Ishikawa diagrams to locate attrition rates at an organization. To gather data, employers can use surveys or exit interviews. In the example below [i], compensation, poor skills, work culture and management styles were identified as potential causes.
Ishikawa diagrams are used to identify the possible causes of a problem and can be helpful in categorizing and organizing the root causes of the problem.
HOW
When constructing an Ishikawa diagram, you begin by stating the problem in question form, such as by asking why. This helps during the brainstorming phase by allowing team members to ask themselves this question. The problem is placed at the “head” of the fish bone diagram as seen in the picture above. Once the question has been determined, a horizontal line is drawn attached to the problem, and several vertical lines (bones) are drawn coming out of the horizontal line. These are labeled with different categories depending on the purpose of the diagram. Once this has been done, possible causes are brainstormed and put in the appropriate categories. When the Ishikawa diagram is done, it shows potential root causes of a problem. Some potential categories are listed below:
The 4 M’s (Manufacturing)
Methods
Machines
Materials
Manpower
The 4 P's (Marketing)
Place
Procedure
People
Policies
The 4 S's (Service)
Surroundings
Suppliers
Systems
Skills
ADVANTAGES
- Simplifies complex problems
- Easy to see relationships
- Shows all causes simultaneously
- Encourages teamwork
DISADVANTAGES
- Oversimplifies complex problems
- Team may be unable to arrive at a consensus for a cause
USE IN THE REAL WORLD
Employers can use Ishikawa diagrams to locate attrition rates at an organization. To gather data, employers can use surveys or exit interviews. In the example below [i], compensation, poor skills, work culture and management styles were identified as potential causes.
RESOURCES
[i] http://www.brighthubpm.com/templates-forms/73027-fishbone-diagrams-examples-for-it/#imgn_1
[i] http://www.brighthubpm.com/templates-forms/73027-fishbone-diagrams-examples-for-it/#imgn_1
- http://quality.enr.state.nc.us/tools/fishbone.htm
- http://asq.org/learn-about-quality/cause-analysis-tools/overview/fishbone.html
- http://en.wikipedia.org/wiki/Ishikawa_diagram
- http://www.isixsigma.com/tools-templates/cause-effect/cause-and-effect-aka-fishbone-diagram/
- http://siteresources.worldbank.org/WBI/Resources/213798-1194538727144/9Final-Fishbone.pdf
Ishikawa Diagram JOB AID
The job aid below is intended to provide first-time practitioners guidance on how to make an Ishikawa diagram.